The Numbers Don't Lie: Financial & Environmental Savings
A common misconception is that sustainable eating is expensive. To test this, I applied my Computer Science background to a biological question and built a Python-based data tracker.
Real Midwest pricing, run through pandas.
Utilizing the pandas and seaborn libraries, I analyzed standard Midwest grocery pricing, comparing a 3,000-calorie, high-protein plant-based budget against a standard omnivorous budget.
Every line item was recorded with its package size, unit price, and monthly quantity, so the comparison holds calories and protein roughly constant instead of comparing a full cart against a lighter one.
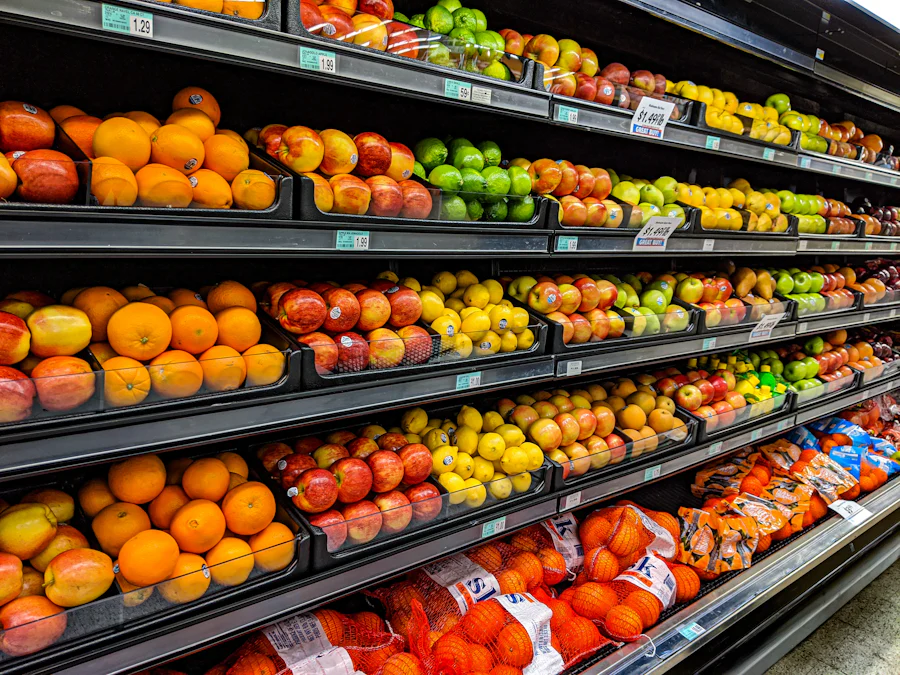
A 16% reduction in monthly grocery spend.
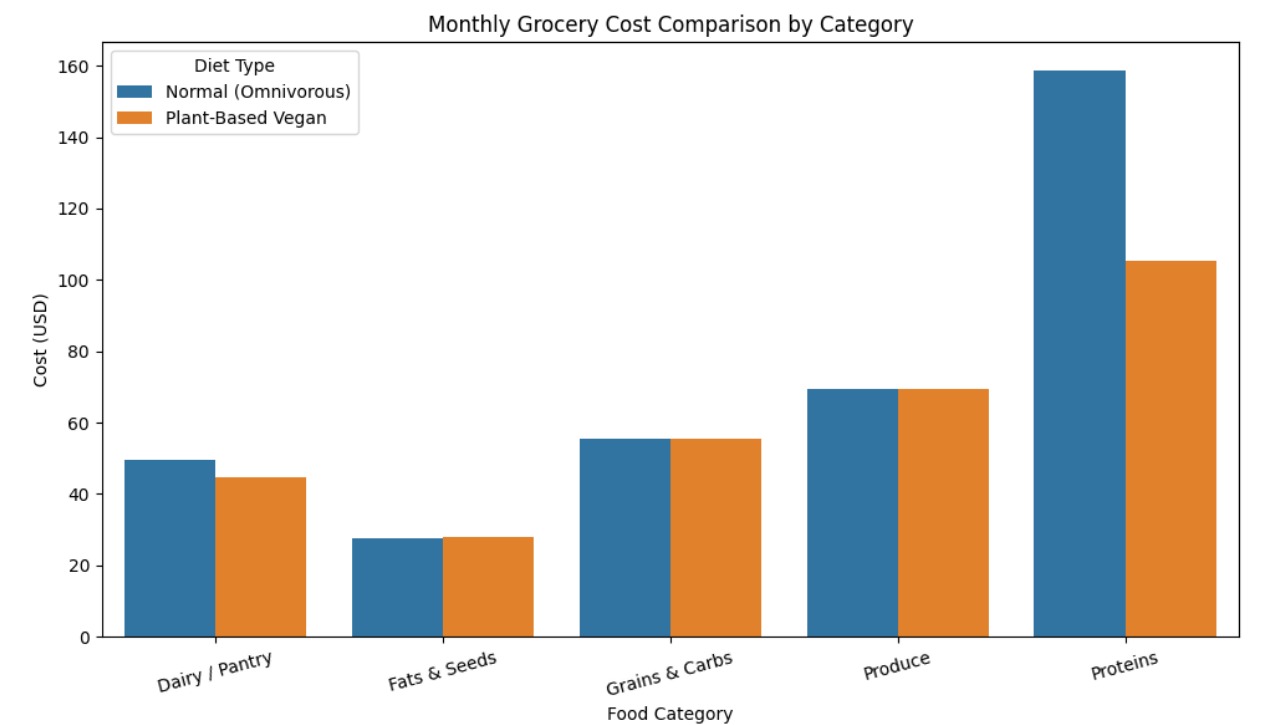
The most significant savings occurred in the protein category. Plant-based staples drastically undercut chicken and ground beef while still fulfilling daily macronutrient requirements.
Protein, line by line.
| Diet | Item | Pkg size | Unit price | Monthly qty | Monthly cost |
|---|---|---|---|---|---|
| Plant-based | Extra Firm Tofu | 14 oz | $2.29 | 12 | $27.48 |
| Plant-based | Dry Red / Brown Lentils | 1 lb | $1.49 | 4 | $5.96 |
| Plant-based | Canned Black / Garbanzo Beans | 15 oz | $0.99 | 16 | $15.84 |
| Plant-based | Seitan | — | — | — | $15.98 |
| Plant-based protein staples shown above | $65.26 | ||||
| Omnivorous | Chicken Breast (boneless / skinless) | 1 lb | $3.99 | 12 | $47.88 |
| Omnivorous | Lean Ground Beef (90/10) | 1 lb | $5.99 | 6 | $35.94 |
| Chicken and ground beef combined | $83.82 | ||||
Reading the table: tofu at $27.48 a month, lentils at $5.96, and seitan at $15.98 replace the $83.82 spent on chicken and ground beef alone — while still hitting the same daily protein target.
Monthly grocery cost, by food category.
This is the exact figure produced by the script below. Produce, grains, and fats land almost on top of each other — the entire spread opens up in the protein column.
Run the numbers yourself.
Want to adapt this for your own household? Here is the Python script I developed to generate the budget visualizations.
import pandas as pd
import matplotlib.pyplot as plt
import seaborn as sns
import io

# Raw grocery data comparing Plant-Based vs Omnivorous diets
csv_data = """Diet Type,Category,Item,Pkg Size,Unit Price (USD),Monthly Qty,Monthly Cost (USD)
Plant-Based Vegan,Proteins,Extra Firm Tofu,14 oz,2.29,12,27.48
Plant-Based Vegan,Proteins,Dry Red/Brown Lentils,1 lb,1.49,4,5.96
Plant-Based Vegan,Proteins,Canned Black/Garbanzo Beans,15 oz,0.99,16,15.84
Normal (Omnivorous),Proteins,Chicken Breast (Boneless/Skinless),1 lb,3.99,12,47.88
Normal (Omnivorous),Proteins,Lean Ground Beef (90/10),1 lb,5.99,6,35.94
# ... [Full dataset available in repository] ...
"""

df = pd.read_csv(io.StringIO(csv_data))
df['Category'] = df['Category'].replace({'Dairy Alts & Pantry': 'Dairy / Pantry', 'Dairy & Pantry': 'Dairy / Pantry'})

# Calculate and visualize category totals
category_totals = df.groupby(['Diet Type', 'Category'])['Monthly Cost (USD)'].sum().reset_index()

plt.figure(figsize=(10, 6))
sns.barplot(data=category_totals, x='Category', y='Monthly Cost (USD)', hue='Diet Type')
plt.title('Monthly Grocery Cost Comparison by Category')
plt.ylabel('Cost (USD)')
plt.xlabel('Food Category')
plt.xticks(rotation=15)
plt.tight_layout()
plt.show()
To run it: install the three dependencies with
pip install pandas matplotlib seaborn, drop your own rows into the CSV block, and
execute the file. The chart above is what comes out.